

Asian Americans and Pacific Islanders in Washington State
In Washington State, there are more than 604,000 Asian Americans and 70,000 Pacific Islanders according to the U.S. Census Bureau. Asian Americans and Pacific Islanders (AAPIs) are among the fastest growing populations in the state and nation. More than 48 distinct Asian and Pacific Islander ethnic groupsexist representing a diverse range of cultures, languages, religions, and immigration patterns.
Washington State has the seventh largest Asian American population and third largest Pacific Islander population in the nation. While nearly 88 percent of the population lives in the greater Puget Sound area, significant populations reside in the Yakima Valley and Clark, Whitman, and Spokane counties.
AAPI Data Disaggregation
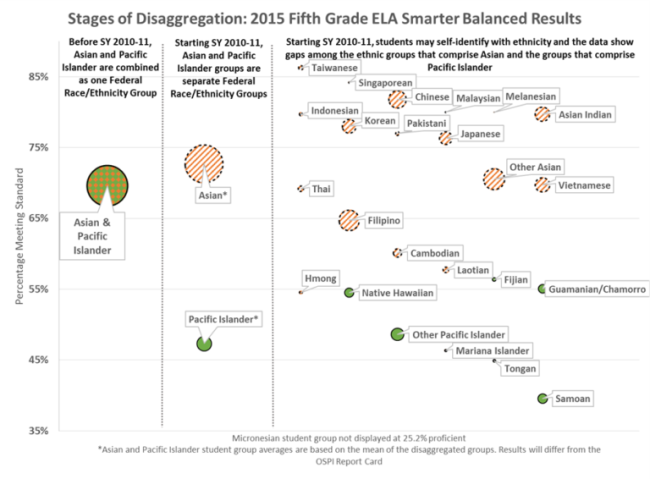
AAPIs are comprised of diverse cultures and ethnic groups, making disaggregated data key in representing their unique experiences and needs. The practice of groupingall AAPIs in one category hides educational, health, and economic disparities facing many communities. Fortunately, Washington State is at the forefront of the AAPI data disaggregation movement, particularly in education, through the work of community advocacy and policymaking.
The chartbelow by the State Board of Education shows why data disaggregation is key in understanding the experiences among AAPI students.
Progress on AAPI Data Disaggregation
Education:The Commission and community leaders have worked closely with policymakers and the Office of the Superintendent of Public Instruction (OSPI) on data disaggregation efforts.
In 2008, the Washington State Legislature funded five achievement gap studies, including two separate, groundbreaking studies of Asian American and Pacific Islander students in the state’s public schools. The studies found hidden educational disparities due to the practice of aggregating data and made recommendations to close the opportunity gaps for all AAPI students.
The Educational Opportunity Gap Oversight and Accountability Committee (EOGOAC) was formed in 2009 todevelop an implementation plan and recommend policies and strategies to close the opportunity gaps. The EOGOAC,which includes two members appointed by the Commission, has been a staunch advocate for analyzing opportunity gaps through deeper disaggregation of student demographic data.
In 2009, OSPI launched the Comprehensive Education Data and Research System (CEDARS), a longitudinal data warehouse of educational data, which enabled the collection of disaggregated data for the following AAPI ethnicities.
- Asian Indian
- Cambodian
- Chinese
- Filipino
- Hmong
- Indonesian
- Japanese
- Korean
- Laotian
- Malaysian
- Pakistani
- Singaporean
- Taiwanese
- Thai
- Vietnamese
- Other Asian
- Native Hawaiian
- Fijian
- Guamanian/Chamorro
- Mariana Islander
- Melanesian
- Samoan
- Tongan
- Other Pacific Islander
In 2015, the National Commission on Asian American and Pacific Islander Research in Education (CARE) released the first study of AAPI disaggregated data from OSPI and theEducation Research and Data Center. The Commission held a launch event with CARE to inform the public about the findings in its report,The Hidden Academic Opportunity Gaps Among Asian Americans and Pacific Islanders: What Disaggregated Data Reveals in Washington State.
The Commission met with the State Board for Community and Technical Colleges regarding the reporting of AAPI data by the colleges, which were being lumped together in one category. Subsequently, the SBCTC released an issue brief, Reporting Asian American and Pacific Islander Student Outcomes, to provide guidance to the colleges about data reform. The issue brieffound that SBCTC should utilize the disaggregated AAPI that it currently collects in its reports andaccountability metrics. In its latest 2016-2017 Field Guide,AAPI population data for each college is now reported in two separate groups.
In 2016, legislation championed by the EOGOAC passed the Legislature, which launched the Race and Ethnicity Student Data Task Force to develop guidance to further disaggregate student data starting in the 2018-19 school year and develop best practices for school administrators to use when identifying the race and ethnicity of students and families. The Commission appointed four members to represent AAPI communities. The RESD completed its work in June 2017 and recommended the following AAPI ethnicity categories be collected:
- Asian Indian
- Bangladeshi
- Bhutanese
- Burmese/Myanmar
- Cambodian/Khmer
- Cham
- Chinese
- Filipino
- Hmong
- Indonesian
- Japanese
- Korean
- Lao
- Malaysian
- Mien
- Mongolian
- Nepali
- Okinawan
- Pakistani
- Punjabi
- Singaporean
- Sri Lankan
- Taiwanese
- Thai
- Tibetan
- Vietnamese
- Carolinian
- Chamorro
- Chuukese
- Fijian
- i-Kiribati / Gilbertese
- Kosraean
- Maori
- Marshallese
- Native Hawaiian
- Ni-Vanuatu
- Palauan
- Papuan
- Pohnpeian
- Samoan
- Solomon Islander
- Tahitian
- Tokelauan
- Tongan
- Tuvaluan
- Yapese
Health:The Commission and community leaders have worked with the Washington State Department of Health (DOH) and Local Health Jurisdictions on data disaggregation efforts.
The Commission and DOH worked together to improve the 2016 Healthy Youth Survey to better reflect Washington’s fast-growing Asian American student population. The survey provides important information about the health of youth in Washington relating to safety and violence, physical activity and diet, alcohol, tobacco and other drug use, and related risk and protective factors. The survey allows students to self-identify their race or ethnicity, such as Native Hawaiian or Pacific Islander. For the first time, the 2016 survey allowed students to choose from the following Asian subgroups: Asian Indian, Chinese, Filipino, Japanese, Korean, Vietnamese, and Cambodian.
In addition, the Commission worked with DOH to include Cambodian as an ethnicity option for respondents on the Behavioral Risk Factor Surveillance System, beginning with the 2016 survey. The BRFSSis a yearly survey that measures changes in the health of people in our state.
Resources
- Race and Ethnicity Student Data Task Force 2017 Report(OSPI)
- 2011-2015 Statewide Detailed Race/Ethnicity Enrollment (OSPI)
- AAPI Data (A project of Karthick Ramakrishnan at the University of California, Riverside)
- iCount: Equity through Representation
- Native Hawaiian and Pacific Islander National Health Interview Survey (CDC)
- OSPI Performance Indicators – Data and Analytics
- Washington State Education Research and Data Center
- White House Initiative on Asian Americans and Pacific Islanders – Data Page